The Reclaim Meter
In short
Move the slider to the number of pallets leaving your site each month and the Reclaim Meter converts it into six figures: CO₂e kept out of the atmosphere, wood diverted from landfill, virgin lumber displaced, sawlog trees left standing, landfill volume avoided and steel nails recovered. Every constant behind it is published so you can check the arithmetic instead of trusting it — which is the opposite of how most sustainability calculators work.
Turn the estimate into a real number
Send your volumes and we will replace this planning estimate with an auditable monthly statement built from weight tickets — the kind your sustainability team can actually cite.
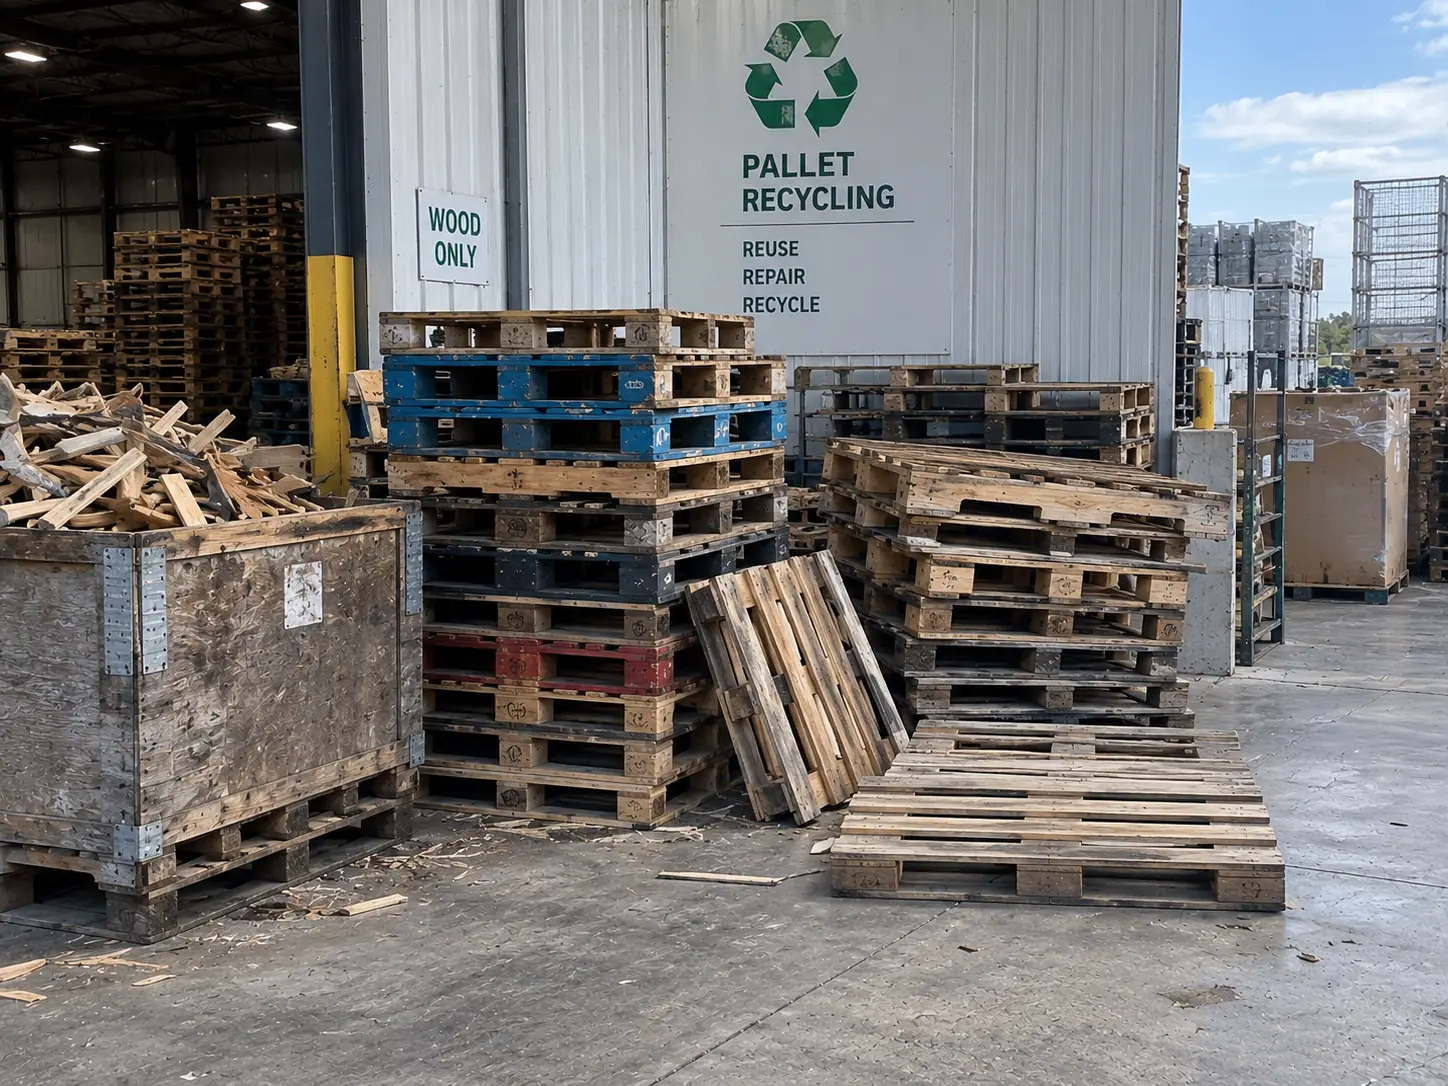
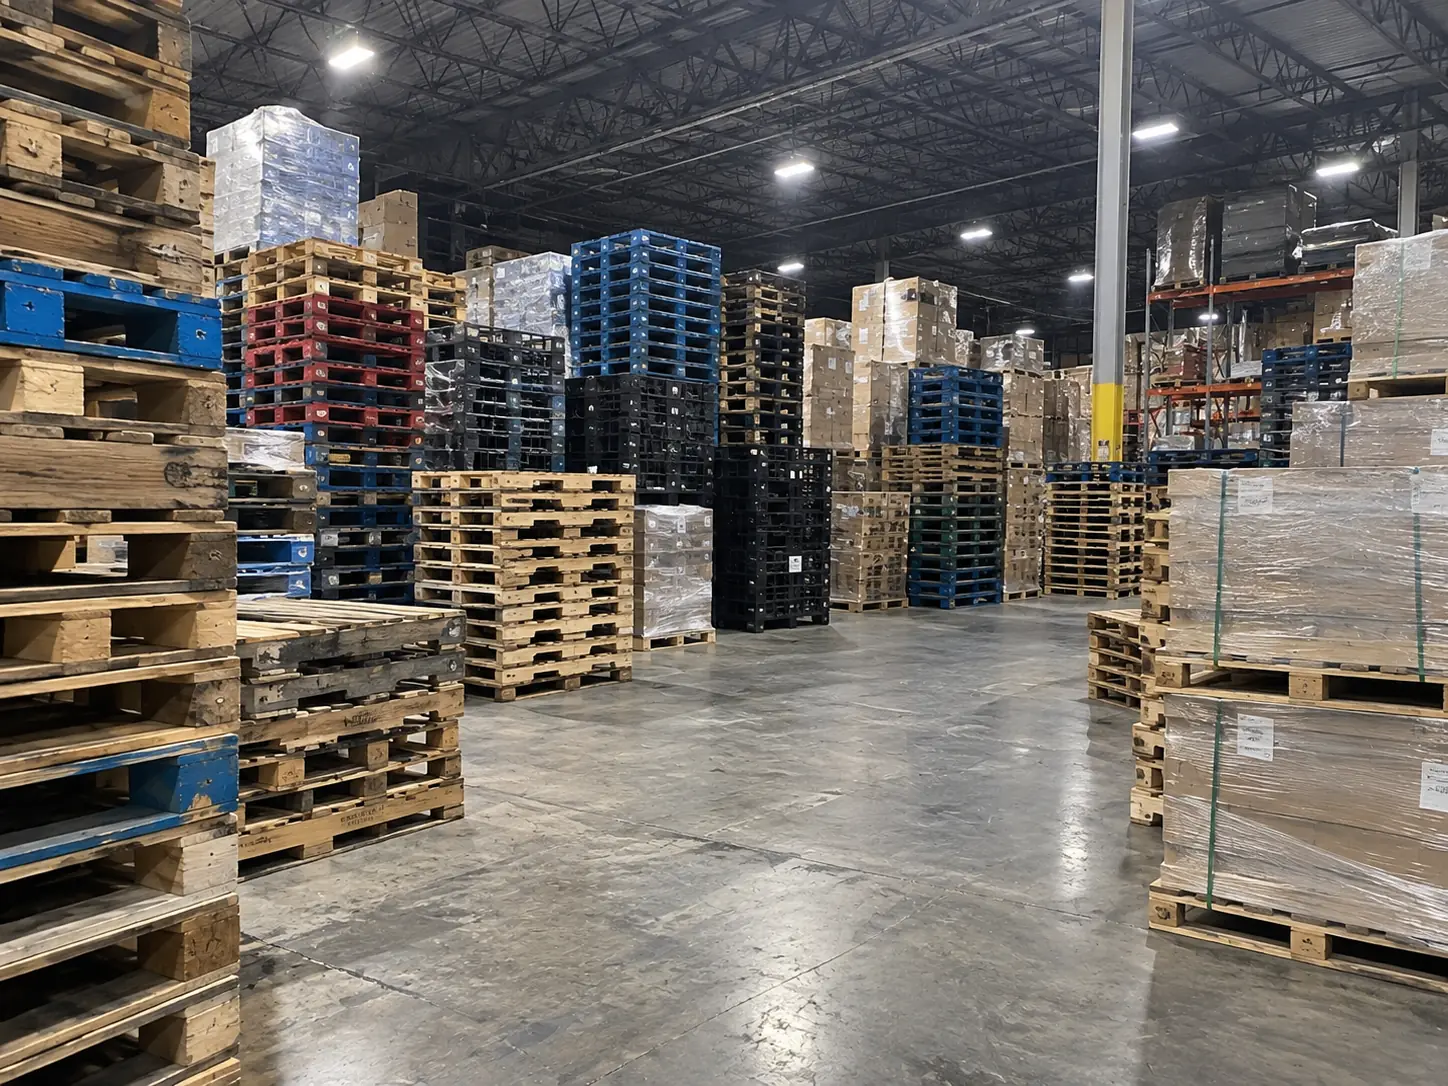
Equivalent to taking 138 average US passenger vehicles off the road for a year. Every constant used here is published on our carbon methodology page so you — or your auditor — can check the arithmetic rather than trust it.
What this number is, and what it is not
A pallet holds carbon that a tree took out of the air. Reuse does not create more of it — it keeps the same carbon out of circulation for longer, and avoids the emissions of building a replacement.
It is a planning estimate
Built from published constants and your stated volume. Good enough to size a programme, not a substitute for weight tickets.
It excludes transport
Freight varies too much by lane to guess honestly. Ask and we will calculate it against your actual mileage.
It does not double-count
Retention, not multiplication. Suppliers claiming full embodied carbon on every trip are counting the same tonne repeatedly.
It has a published method
Every constant, conversion and assumption is on one page, so your auditor can disagree with us specifically.
About the Reclaim Meter
Where do these numbers come from?
Is this a real figure or a marketing number?
Why does transport not appear in the calculation?
Can I use these figures in our ESG report?
What does "replacing new pallets" change?
Three worked examples
The calculator above is interactive; these are three fixed cases so you can see the shape of the answer without touching anything.
| Operation | Pallets / month | Species | Replacing new? | CO₂e per year | Trees left standing |
|---|---|---|---|---|---|
| A single mid-size DC | 1,200 | Mixed hardwood | Yes | ~660 tonnes | ~970 |
| A regional manufacturer | 3,500 | Mixed hardwood | Yes | ~1,930 tonnes | ~2,820 |
| A multi-site 3PL | 12,000 | Mixed yard average | Yes | ~5,990 tonnes | ~8,750 |
| Same DC, diversion only | 1,200 | Mixed hardwood | No | ~500 tonnes | ~970 |
The difference between the first and last rows is the honest one. If you were going to landfill the wood and buy nothing, the avoided-manufacture term does not apply and the real number is smaller. Suppliers who apply it regardless are inflating by roughly a quarter.
Everything this calculator leaves out
| Excluded | Why | How to get it |
|---|---|---|
| Transport emissions | Varies too much by lane to estimate honestly at tool level | Ask — we calculate against your actual mileage |
| Yard energy, kiln fuel, forklift propane | Real and modest; excluding it makes our number slightly flattering | Included in site-specific reporting on request |
| End-of-life release from mulch or fuel | Our figure is retention during service life, not permanent sequestration | Stated openly rather than implied away |
| Your own handling and storage | We cannot see it | A pallet audit will surface it |
| Film, banding and secondary packaging | Different material stream entirely | Reported separately on a managed programme |
| Repeated counting across trips | Reuse retains the same carbon longer; it does not create more | Deliberately not done here |