Leak 1 — paying to discard an asset
Dumpster and hauling charges for wood that has positive market value. We see this at roughly a third of new accounts.
A pallet management program replaces the four vendors most operations use — one to supply, one to haul away, one to repair and one nobody remembers hiring — with a single closed loop. We forecast your demand, deliver against it, recover the empties, repair what is worth repairing, recycle the rest and send one invoice with the core value already netted out.
Send the details and a named person at the Evendale yard replies within one business day with pricing, freight and a piece count — in writing.
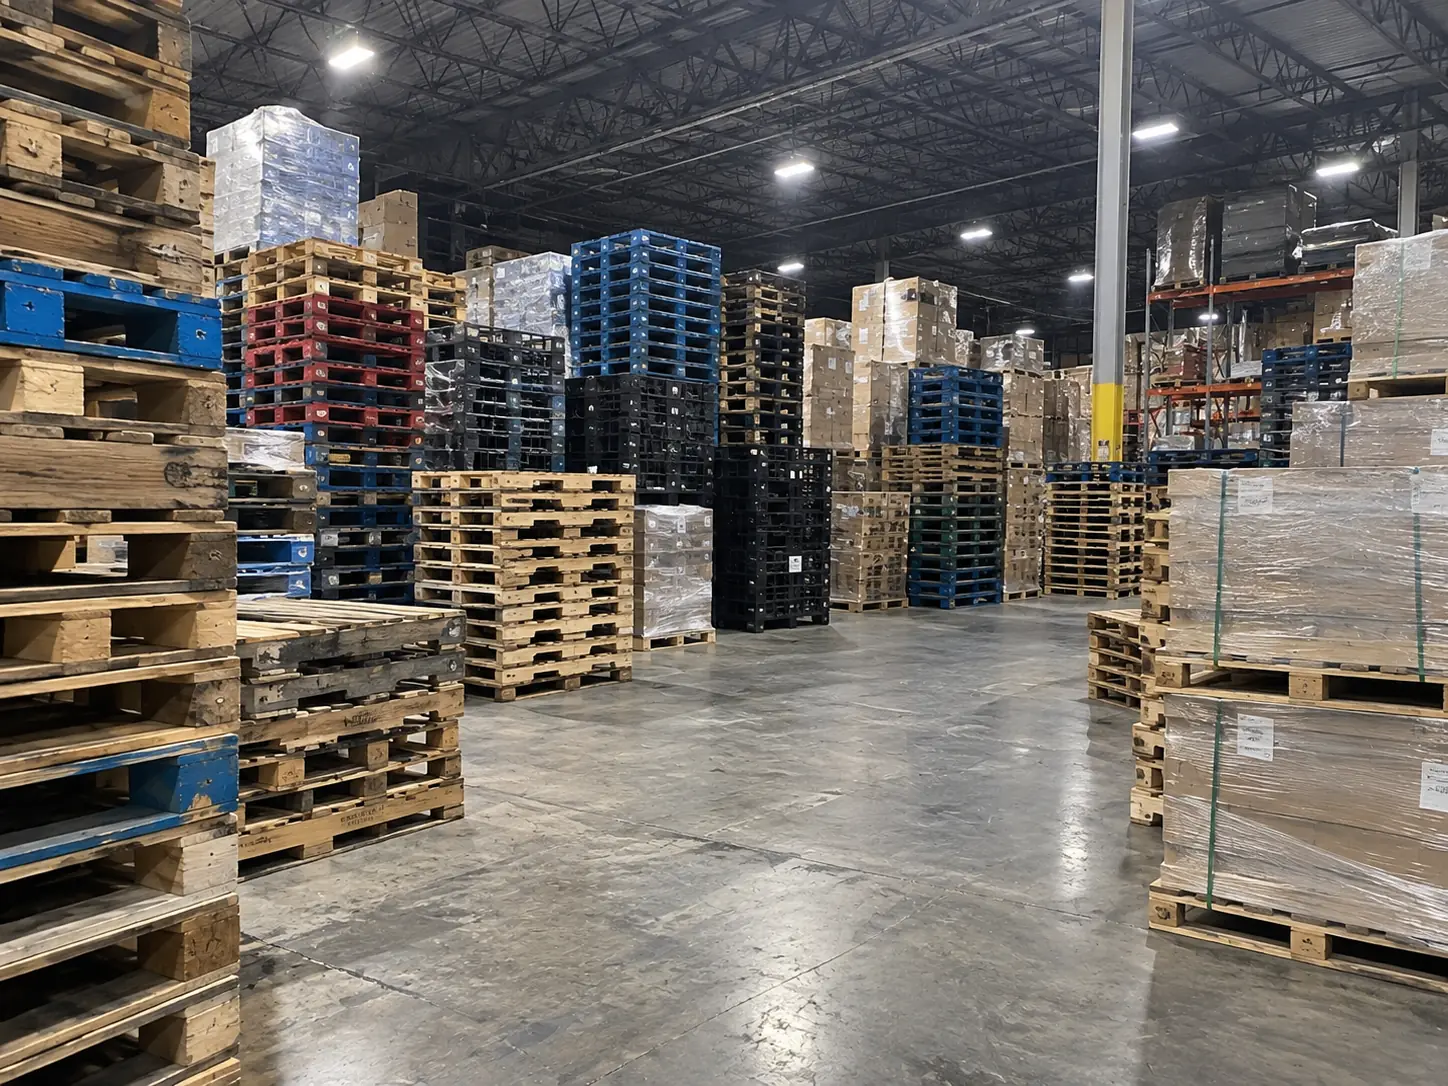
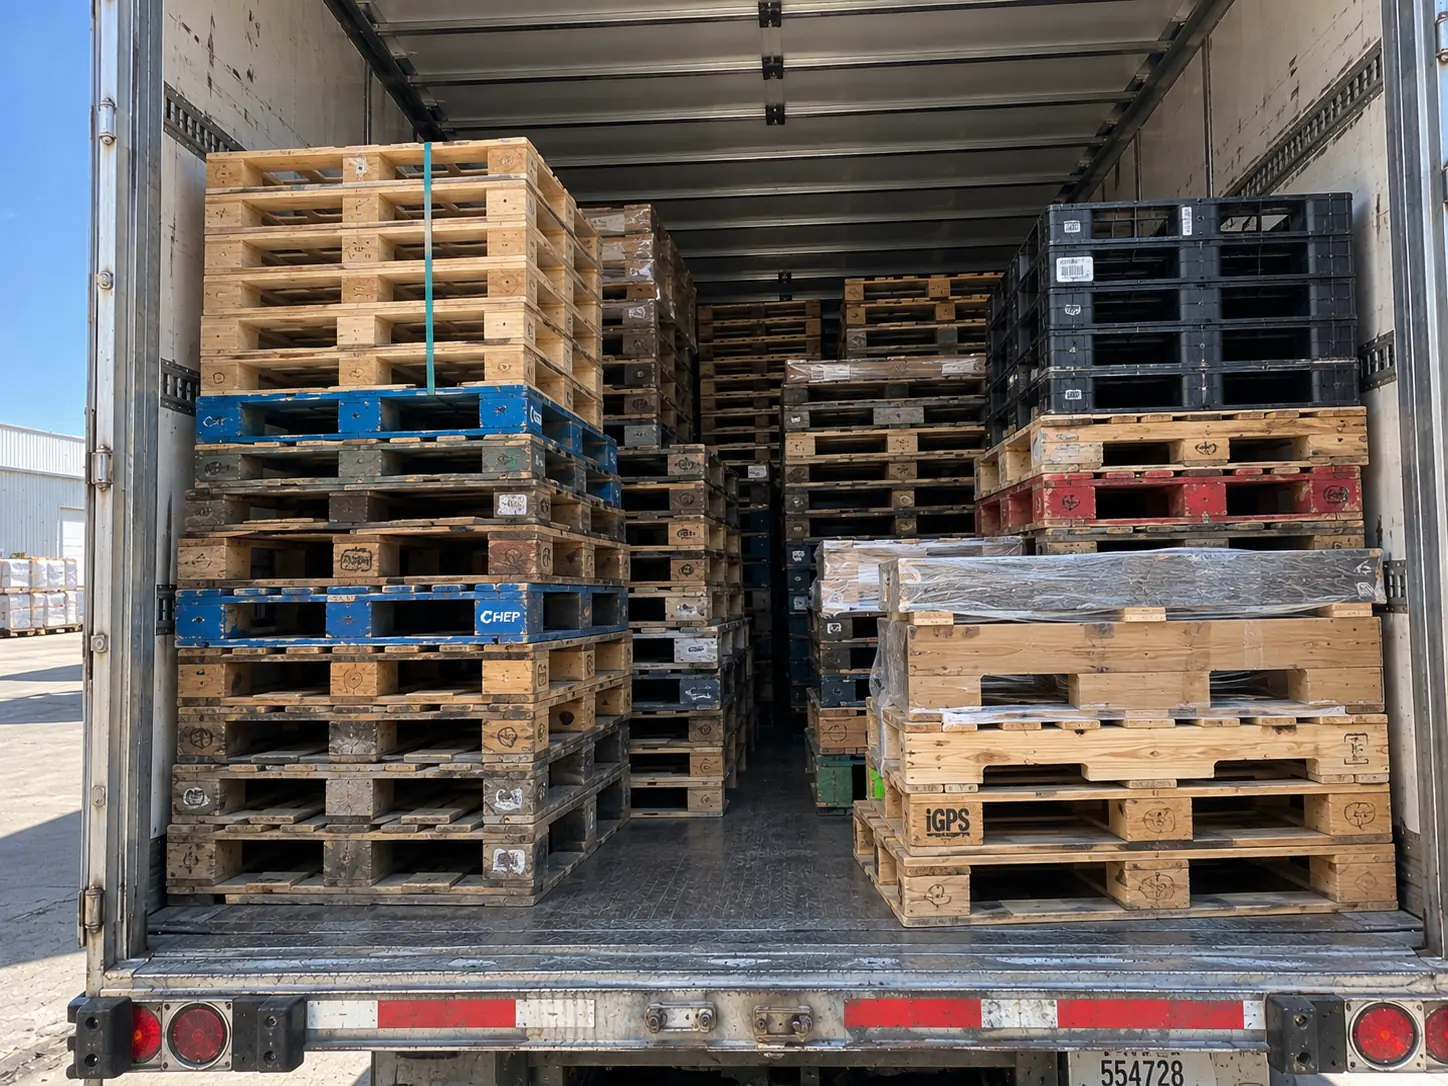
Most operations run an open pallet loop without ever deciding to. Pallets are purchased as a consumable, used once or twice, and disposed of as waste — often paying at both ends. The leaks are rarely dramatic; they are small, continuous and invisible on a P&L that lists "packaging" as one line.
Dumpster and hauling charges for wood that has positive market value. We see this at roughly a third of new accounts.
Buying A grade for internal movement that never leaves the building. A very common and very expensive habit.
Running out on a Friday and paying spot rates. Forecasting removes this almost entirely.
Separate vendors for delivery and removal means two trucks doing half a job each.
Scrapping pallets that needed one deck board. Without a sort step nobody ever sees the difference.
A pallet pile occupies square footage you are already paying rent and heat on. It is the cost nobody assigns.
| Phase | Duration | What happens |
|---|---|---|
| Discovery | Week 1 | Volume data review, dock walk at each site, current-state cost baseline |
| Specification | Week 2 | Grade-by-application spec written and agreed; receiving instructions issued |
| Pilot | Weeks 3–6 | Single site runs the full loop; schedule and trailer sizing tuned against reality |
| Rollout | Weeks 7–12 | Remaining sites brought on in volume order; reporting consolidated |
| Steady state | Quarter 2 onward | Quarterly reviews, seasonal forecast adjustment, continuous grade optimisation |
Published in full, because "we provide reporting" is a claim and a field list is a commitment. This is every field on the statement, per site, with a corporate roll-up on top.
| Field | Basis | Why it is there |
|---|---|---|
| Inbound weight, tons | Weighbridge ticket per trailer | The denominator. Everything else is a share of this. |
| Inbound piece count | Signed tally sheets | Reconciled against weight; a divergence is a moisture signal. |
| Direct reuse, tons and % | Weighed at the banding station | The highest-value outcome, reported separately on purpose. |
| Repair and return, tons and % | Weighed at bench outfeed | Separated from reuse because the energy input differs. |
| Board harvest, tons and % | Weighed at dismantler outfeed | Material retained as lumber rather than as a pallet. |
| Remanufacture, tons and % | Weighed at jig outfeed | Rebuilt into a different footprint. |
| Fibre recovery, tons and % | Weighed at grinder outfeed | Value largely released; carbon on a short clock. |
| Ferrous recovery, tons | Bale weights | The stream nobody counts. |
| Licensed disposal, tons and % | Weighed, disposal ticket attached | Named rather than absorbed into a rounding. |
| Diversion rate, % | Calculated from the above, by weight | One number, with all its components visible above it. |
| Estimated CO₂e retained, tonnes | Published constants, linked method | Planning figure, labelled as such. |
| Avoided manufacture, tonnes CO₂e | Applied only where reuse replaced a purchase | Separated so it can be excluded if your auditor prefers. |
| Core credits applied, $ | Netted against supply invoices | So the loop appears as one number, not two processes. |
| Grade split delivered | Grade sheets | Shows whether right-sizing is holding or drifting back up. |
| Cost per shipment | Total pallet spend ÷ shipments | The trend line that matters at the quarterly review. |
| Exceptions log | Route desk | Missed windows, rejected loads, contamination found. Reported, not buried. |
CSV export is available for customers feeding their own ESG platform, and the underlying weighbridge tickets are supplied on request rather than only the summary.
Ninety minutes, four times a year, same agenda every time. Published because a supplier who cannot tell you what the review covers has not planned one.
Ranked by how often each is the largest contributor across our accounts. Note where unit-price negotiation sits, and note that it is where almost every procurement process begins.
| Lever | Rank by frequency | Typical mechanism |
|---|---|---|
| Grade right-sizing | 1 | Internal-movement and inbound-receiving pallets moved off premium grades. |
| Paired delivery and collection freight | 2 | One truck movement instead of two. Roughly 30% of delivered cost structure on mid-range lanes. |
| Core value recovered rather than discarded | 3 | Often removes a waste-hauling line entirely at the same time. |
| Repair instead of replacement | 4 | A sort step in front of the scrap pile. Most "broken" pallets need one board. |
| Eliminated disposal charges | 5 | Roughly a third of new accounts were paying both to buy and to discard. |
| Forecast-driven ordering | 6 | Removes emergency spot buying, which is the most expensive way to buy this product. |
| Floor space released | 7 | Real rent, heat and insurance that no accounting system codes to packaging. |
| Unit price negotiation | 8 | Smallest, and the one everybody starts with. |