Twelve months of grading data, published
In short
Across twelve months, roughly 55 percent of intake was reusable without tools, 27 percent needed repair, 9 percent was dismantled for board harvest, 5 percent was remanufactured into other footprints, and 3 percent went to fibre. The most common single rejection reason was a cracked stringer, and the most common single repair was a replaced deck board — which together say most of what there is to say about this business.
Talk to us about this
If this piece describes a problem you actually have, describe it back to us in the message field. You will get a written answer from a person within one business day.
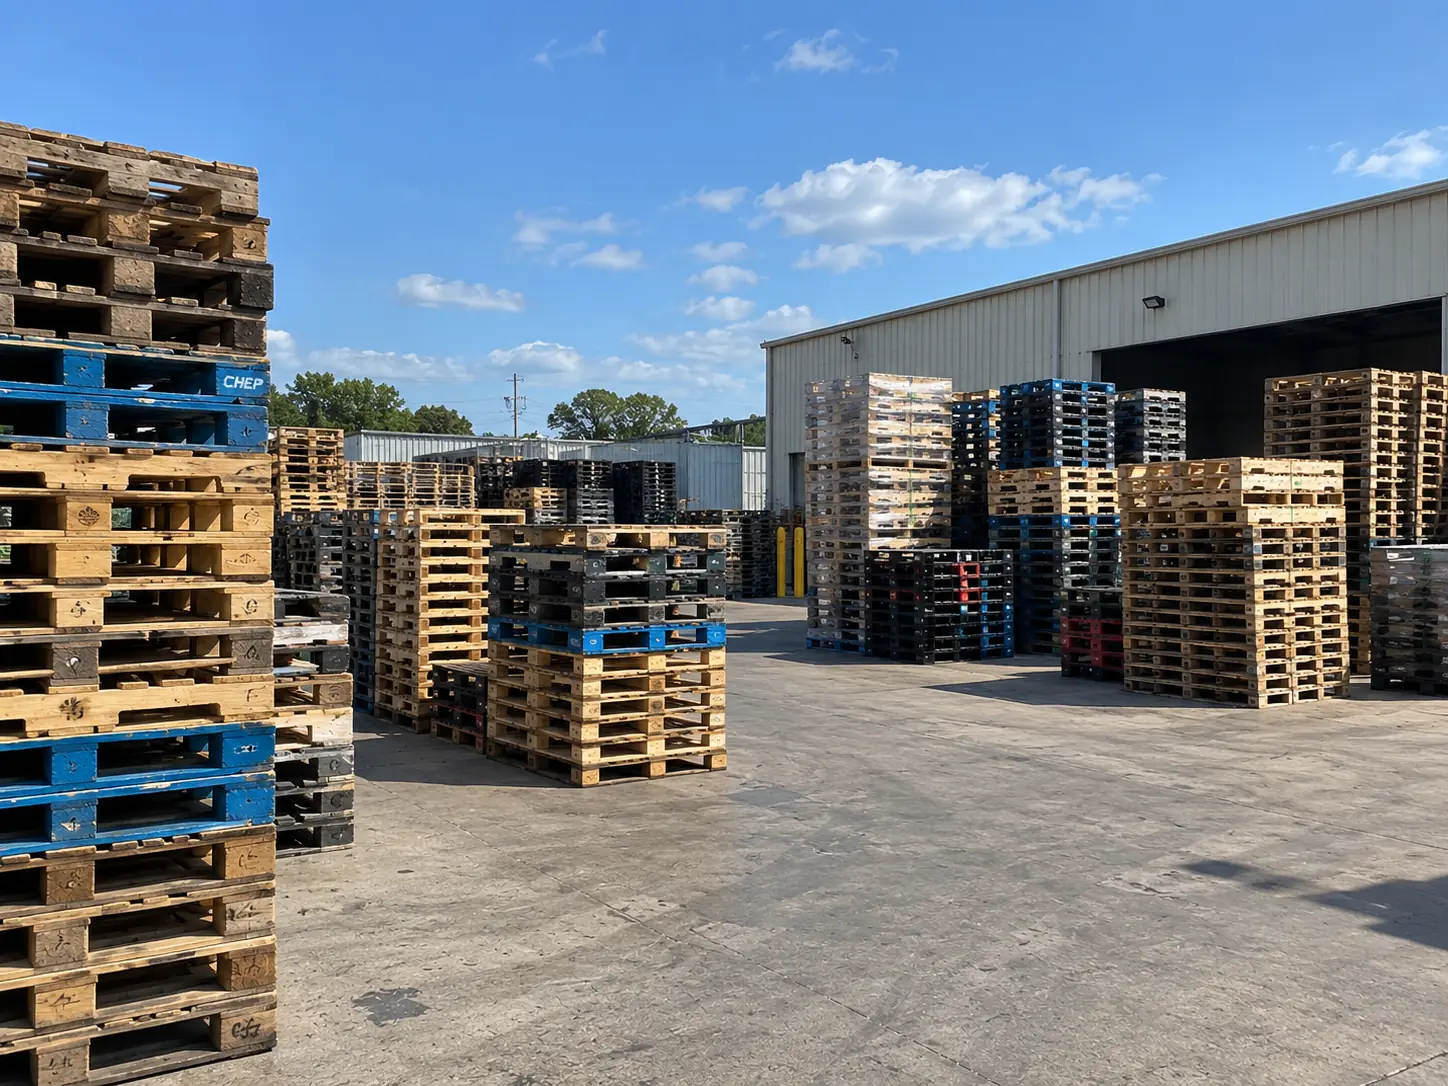
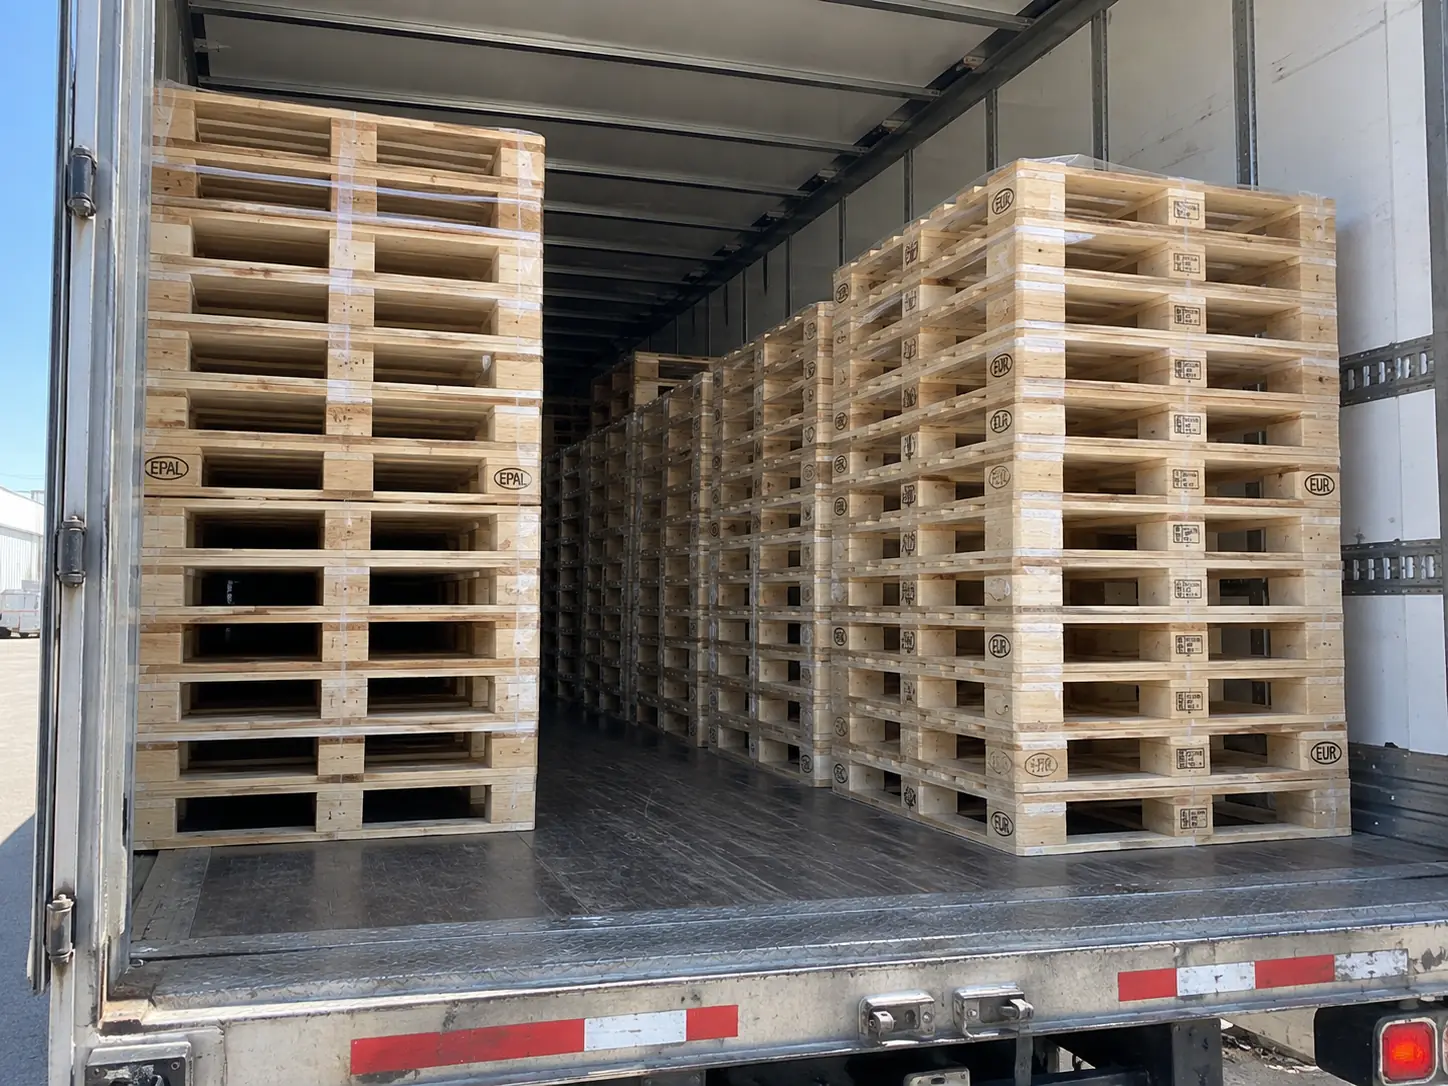
Where intake went
| Outcome | Share of intake | What it means |
|---|---|---|
| Direct reuse | ~55% | Cleaned, inspected, graded, banded. No tools touched it |
| Repair | ~27% | One or two members replaced; back to #1 or #2 grade |
| Board harvest | ~9% | Frame beyond saving, lumber recovered as repair stock |
| Remanufacture | ~5% | Rebuilt on a jig into a different footprint |
| Fibre recovery | ~3% | Ground, magnet-separated twice, screened |
| Licensed disposal | <1% | Contaminated units and non-wood debris |
Why units left the reuse stream
| Reason | Relative frequency | Usual downstream outcome |
|---|---|---|
| Cracked or split stringer | Most common | Plug, companion, or dismantle |
| Missing or broken deck boards | Second | Board replacement at the bench |
| Shiner / protruding fastener | Third | Refastened and returned to the line |
| Moisture or mould bloom | Fourth — heavily seasonal | Dried and re-inspected, or dismantled |
| Contamination or staining | Fifth | Segregated; licensed disposal if chemical |
| Dimensional variance | Sixth | Diverted to non-automation stock |
Cracked stringers leading the list is unsurprising and worth stating anyway: the stringer is the structural member, it is where fork trucks hit, and it is the component whose failure cannot be hidden. It is also why the first check in the grading sequence is the stringer, both faces.
The seasonal signal
Rejection rates from the reuse stream rise noticeably in spring. It would be easy to read that as grader drift, and we checked for exactly that. It is not. It is moisture: cores collected in March and April have spent weeks in Ohio rain, and wet wood grades worse on appearance, carries more mould risk and is structurally weaker while wet.
That single finding is why we now raise covered storage with every customer who sells cores regularly, and why the drop-trailer arrangement gets recommended as much for stock protection as for dock convenience. The data made a soft recommendation into a specific one.
Why publish it
Because a diversion rate on its own is a claim, and claims in this industry are not audited. Publishing the cascade underneath it — and the rejection reasons underneath that — gives anybody who wants to check a place to start. It also makes it much harder for us to quietly let a number drift, which is the more useful discipline.
We have revised two published constants downward since 2021 after customers' consultants made persuasive cases. If something here looks wrong to you, the same offer stands.
Appendix: the data behind this
Every piece on this site closes with the slice of our operating record that bears on what it argues. The full record is published at /resources/operating-record.
The rejection distribution in full
This is the dataset the article discusses, published in the same form we work from internally.
- Cracked or split stringer34.2%
Almost always at a notch. The single most common structural failure we see.
- Missing or broken deck board26.8%
Lead boards over interior boards by roughly two to one — they take the fork impact.
- Shiner / protruding fastener11.4%
Refastened and returned to the line in most cases. A rejection regardless of grade.
- Moisture above 19% or mould bloom10.1%
Heavily seasonal. 18.9% of March rejections; 4.2% of July rejections.
- Contamination, staining or odour7.3%
Pulled by a person at the intake belt, before any downstream process.
- Companion stringer or plate from a prior repair5.2%
We accept companions as #2. Metal plates we reject outright, inbound and outbound.
- Dimensional variance outside tolerance3.1%
Diverted to non-automation stock rather than scrapped.
- Pest damage or exit holes1.9%
Segregated immediately. Never enters the export or studio stream.