What we learned weighing every trailer for a year
In short
Weighing every inbound and outbound trailer for twelve months produced three findings we did not expect: seasonal moisture swings large enough to distort piece-count reporting, a steel recovery rate higher than the published averages we had been using, and a measurable difference in core value between covered and uncovered customer storage. Two of our published constants changed as a result, and both changes made our headline numbers smaller.
Talk to us about this
If this piece describes a problem you actually have, describe it back to us in the message field. You will get a written answer from a person within one business day.
Finding one: piece counts lie in spring
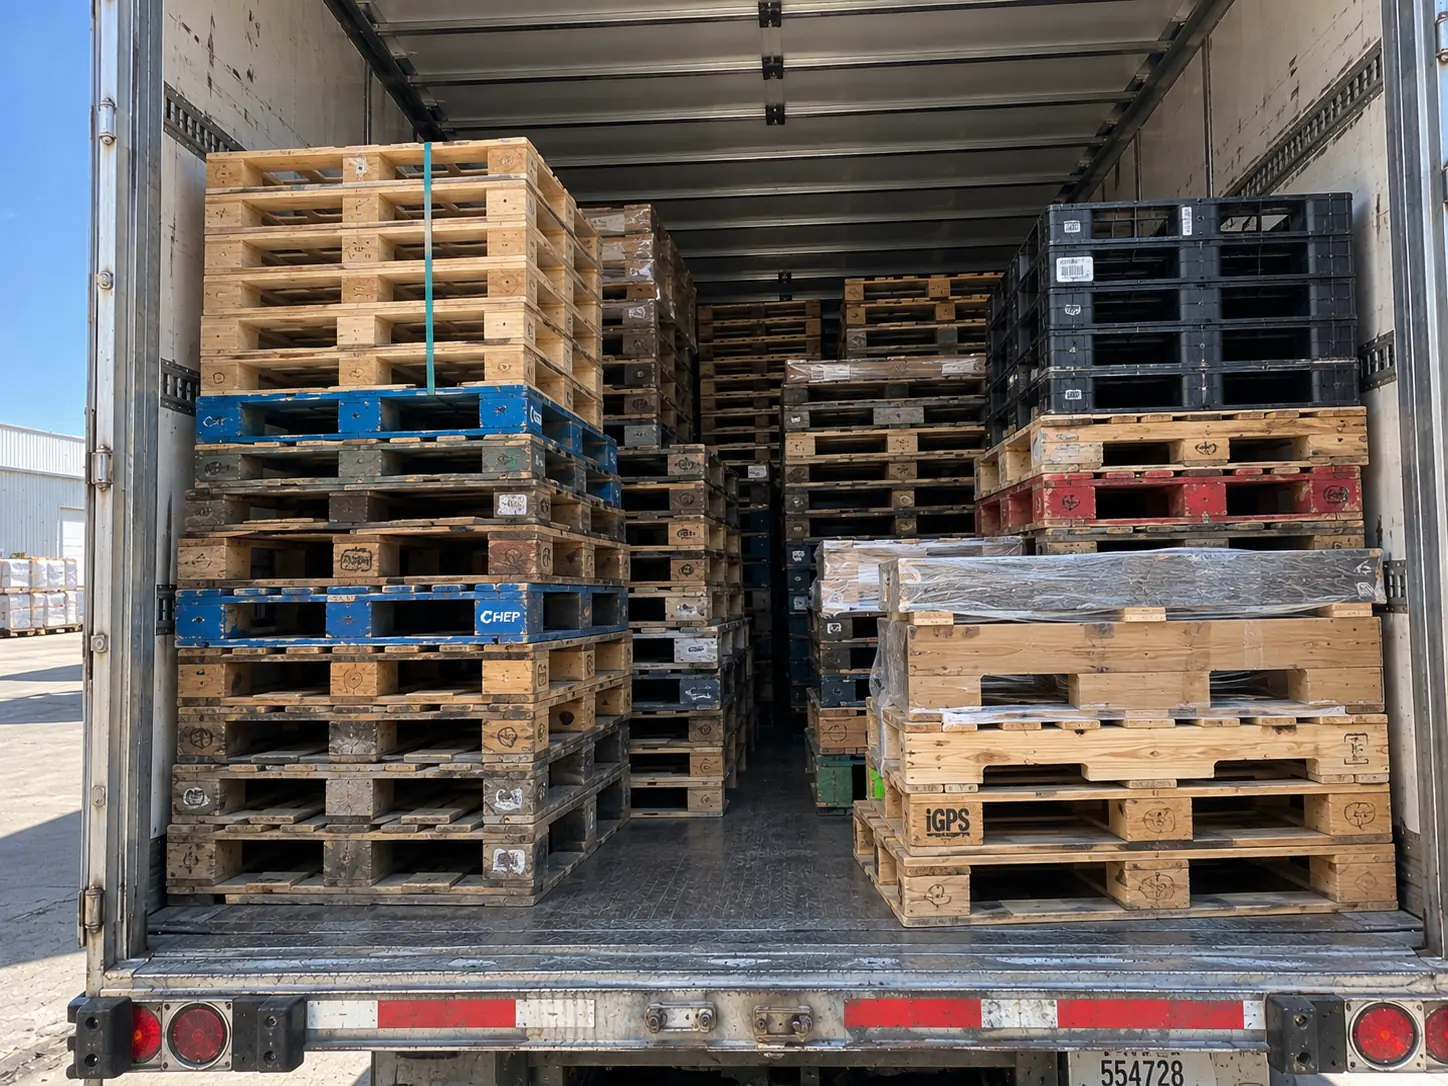
Inbound weight per pallet is not constant. Across twelve months it varied by a substantial margin, peaking in April and bottoming in a dry September. The pallets were not different; the water in them was.
This matters for reporting. A diversion rate calculated from piece counts will look stable across the year while the actual tonnage moving through the building swings considerably. Worse, the material most likely to end up in the disposal stream — soaked, mould-bloomed, split — is also the heaviest, so piece counting systematically understates the disposal fraction. That is a flattering error, which is exactly the kind worth being suspicious of.
We report by weight for this reason, and we would encourage anybody reading a supplier's diversion report to ask which basis it uses before reading anything else in it.
Finding two: more steel than the textbooks say
We had been using a published average for steel content per pallet. Weighing our own magnetically separated bales against the pallets that produced them put the real figure above that average. The likely explanation is repair history: a pallet that has been through several repair cycles carries the original fasteners plus every subsequent one, and the recovered pool skews toward repaired units.
We revised the constant upward on our carbon methodology page. It is one of the few revisions that made a number look better, and it is also one of the smallest in overall significance — but it was measured, so it went in.
Finding three: covered storage shows up in the data
Cores collected from customers with covered storage weigh consistently less per unit and grade consistently better than cores from open piles. We suspected this; the weighbridge quantified it. The difference is large enough that it is now the first thing we raise with any customer selling cores regularly.
The practical advice that came out of it is unglamorous: move the pile under an existing overhang, shorten the collection interval, or take a drop trailer. All three are cheap, and all three show up in what we can pay.
Why we publish this
Sustainability claims are worth what the underlying data can survive. We publish our constants, our method and our exclusions so that a customer's auditor can disagree with us specifically rather than generally. Two of those constants have been revised since first publication after customers' consultants made persuasive cases, and both revisions made our headline numbers smaller.
A methodology that never changes is probably not being checked by anybody. That is not a comfortable thing to publish and it is the most useful signal we can give.
Appendix: the data behind this
Every piece on this site closes with the slice of our operating record that bears on what it argues. The full record is published at /resources/operating-record.
The monthly intake record
This is the dataset the article is about: every inbound and outbound trailer weighed for twelve months, and what it changed.
Read this chart as a table
| Period | Value (thousands of pallets) |
|---|---|
| Sep | 121 |
| Oct | 119 |
| Nov | 110 |
| Dec | 104 |
| Jan | 139 |
| Feb | 131 |
| Mar | 127 |
| Apr | 123 |
| May | 117 |
| Jun | 113 |
| Jul | 105 |
| Aug | 108 |