Summer core supply and the paradox of the busy season
In short
Recycled pallet supply is a by-product of pallets being emptied, not of pallets being used. A busy summer means more pallets in service — sitting under product in racks and trailers — and therefore fewer sitting empty on docks. High economic activity tightens core supply at exactly the moment demand for recycled stock rises.
Talk to us about this
If this piece describes a problem you actually have, describe it back to us in the message field. You will get a written answer from a person within one business day.
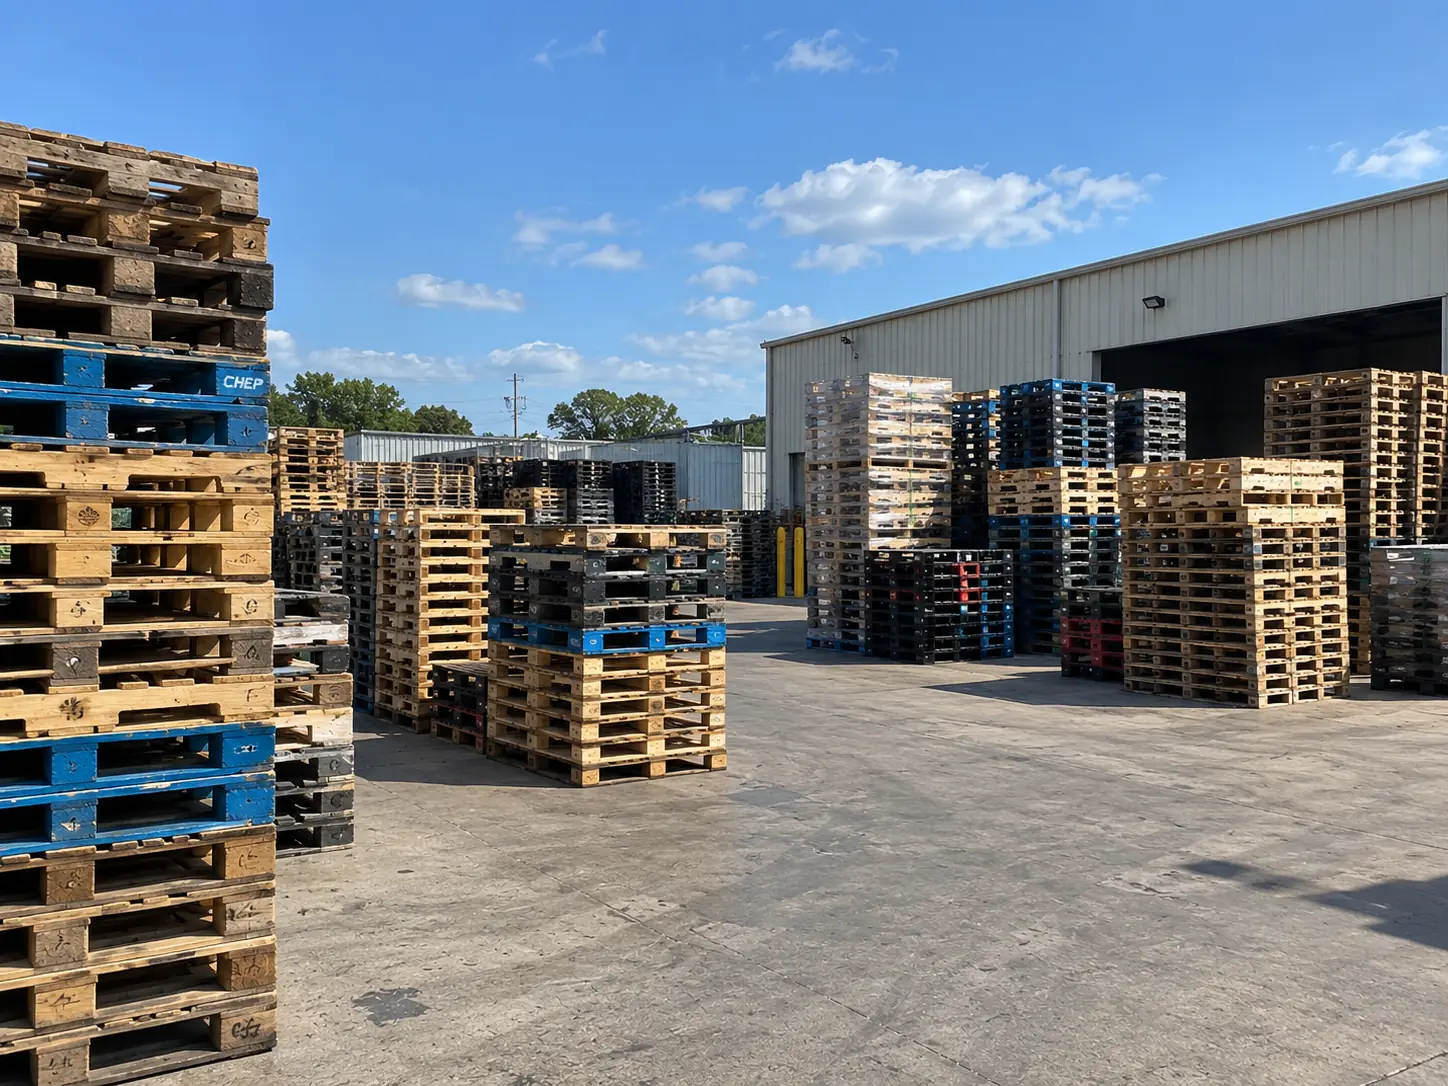
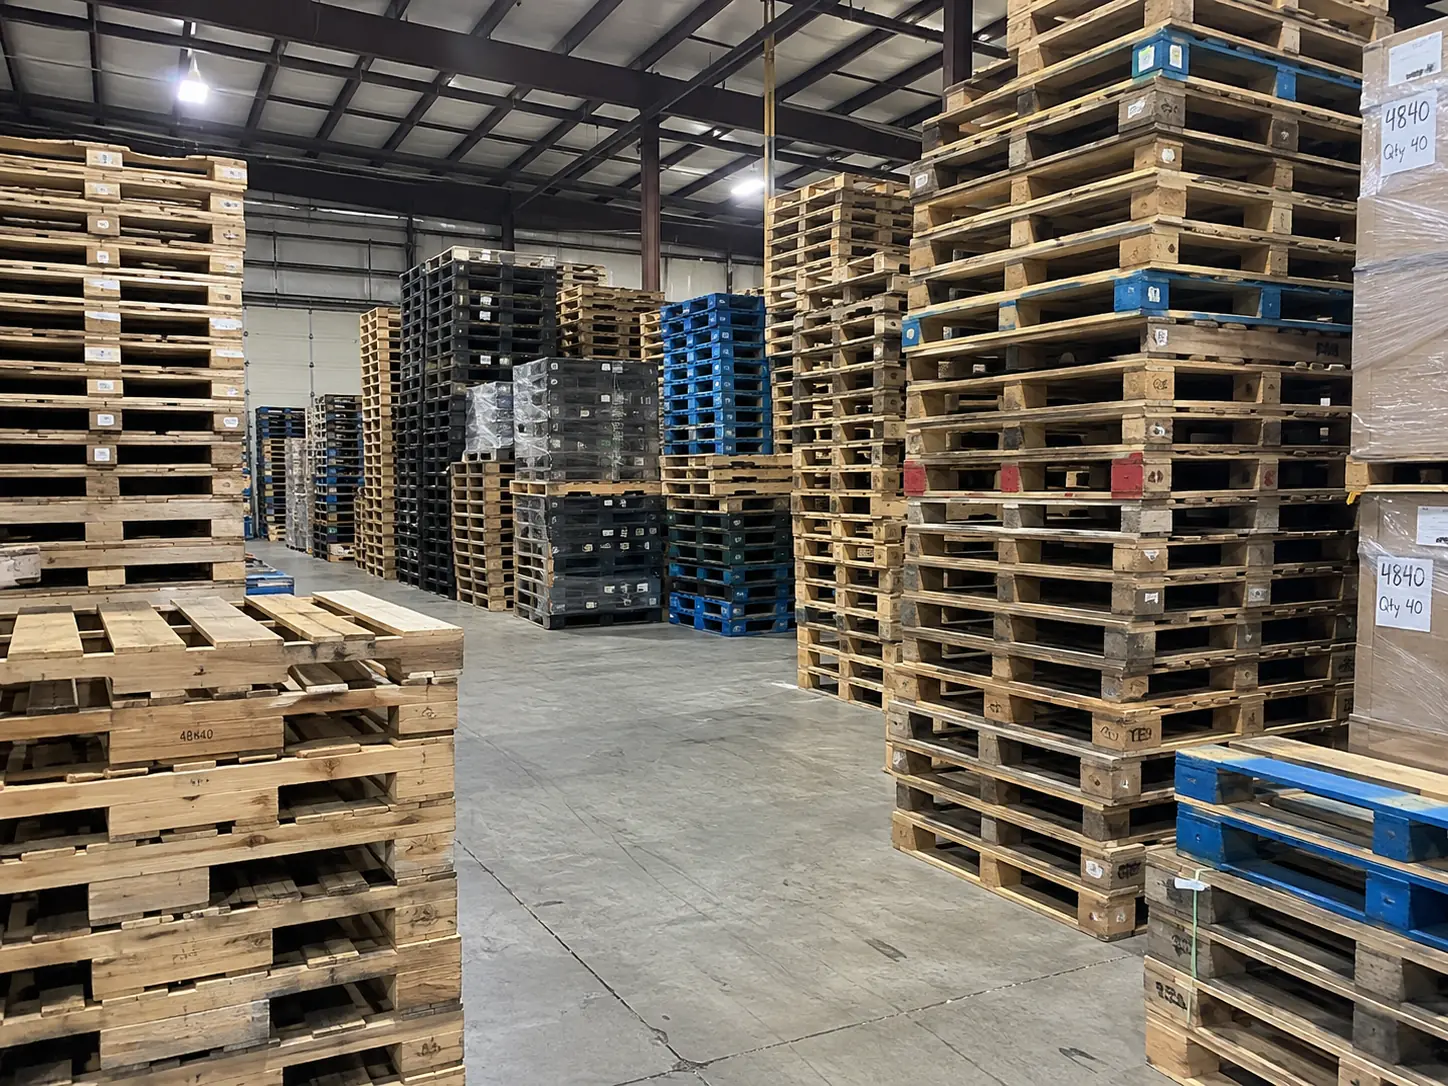
The paradox, stated plainly
A recycled pallet cannot be manufactured on demand. It has to arrive as a core, and a core only exists when somebody finishes with a pallet. That makes supply a function of turnover completion rather than of activity — and in a busy period, more of the installed pallet base is in use and less of it is finished.
The intuition that busy equals plentiful is correct for almost every manufactured product and wrong for this one. It is the single most common misunderstanding we encounter, and it is entirely reasonable until somebody explains it.
Agriculture makes it sharper
In the Ohio Valley the summer effect is amplified by agriculture. Harvest and produce distribution absorb an enormous number of pallets over a compressed period, and those pallets do not come back until the season ends. A region that was a net supplier of cores in May becomes a net consumer in August.
- Produce and agriculture: absorbs heavily July through October
- Beverage: peaks in summer, with the added complication of moisture
- Construction products: summer building season absorbs steadily
- Retail: builds from August for the Q4 peak
- Automotive: absorbs around model-year launch, which moves year to year
Planning around it
| If you are | Do this | Not this |
|---|---|---|
| Buying recycled stock | Commit volume on an annual agreement with allocation priority | Spot-buy in August and October |
| Selling cores | Release in the tight months — July to November | Release on a fixed quarterly calendar |
| Both | Pair the flows; net core value against supply | Run them as two unrelated processes |
| Seasonal yourself | Tell your supplier your calendar in advance | Expect them to guess it |
Appendix: the data behind this
Every piece on this site closes with the slice of our operating record that bears on what it argues. The full record is published at /resources/operating-record.
Core supply against demand, indexed
Look at July and August: supply at 94 and 91, demand at 109 and 112. Busy months produce fewer available pallets, not more.
Read this chart as a table
| Month | Core supply | Demand |
|---|---|---|
| Sep | 92 | 114 |
| Oct | 86 | 121 |
| Nov | 81 | 118 |
| Dec | 89 | 96 |
| Jan | 127 | 78 |
| Feb | 121 | 82 |
| Mar | 112 | 91 |
| Apr | 106 | 97 |
| May | 103 | 101 |
| Jun | 98 | 106 |
| Jul | 94 | 109 |
| Aug | 91 | 112 |