Why Q4 pallet prices move before Q4 does
In short
Recycled pallet pricing is driven by core supply, and core supply is counter-cyclical to demand. Retailers and manufacturers build inventory through late summer, which means they hold pallets rather than releasing them, at exactly the moment everyone wants to buy. The spread between A grade and economy widens from August, peaks in October and November, and collapses again in January when the same pallets come back into the market all at once.
Talk to us about this
If this piece describes a problem you actually have, describe it back to us in the message field. You will get a written answer from a person within one business day.
The mechanism
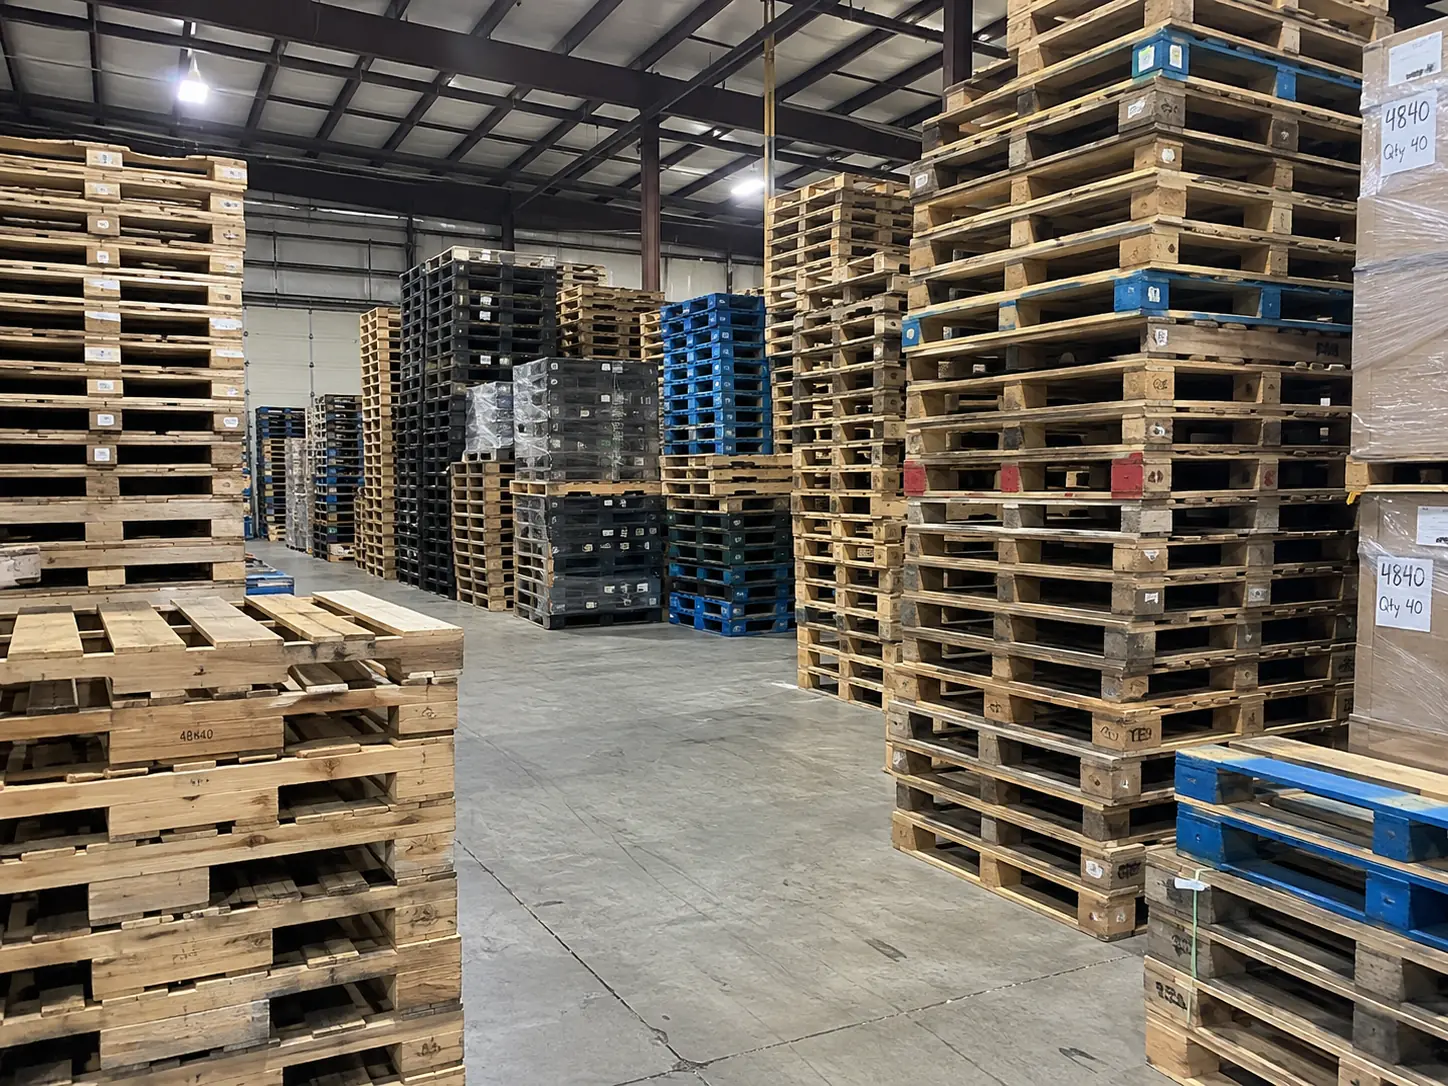
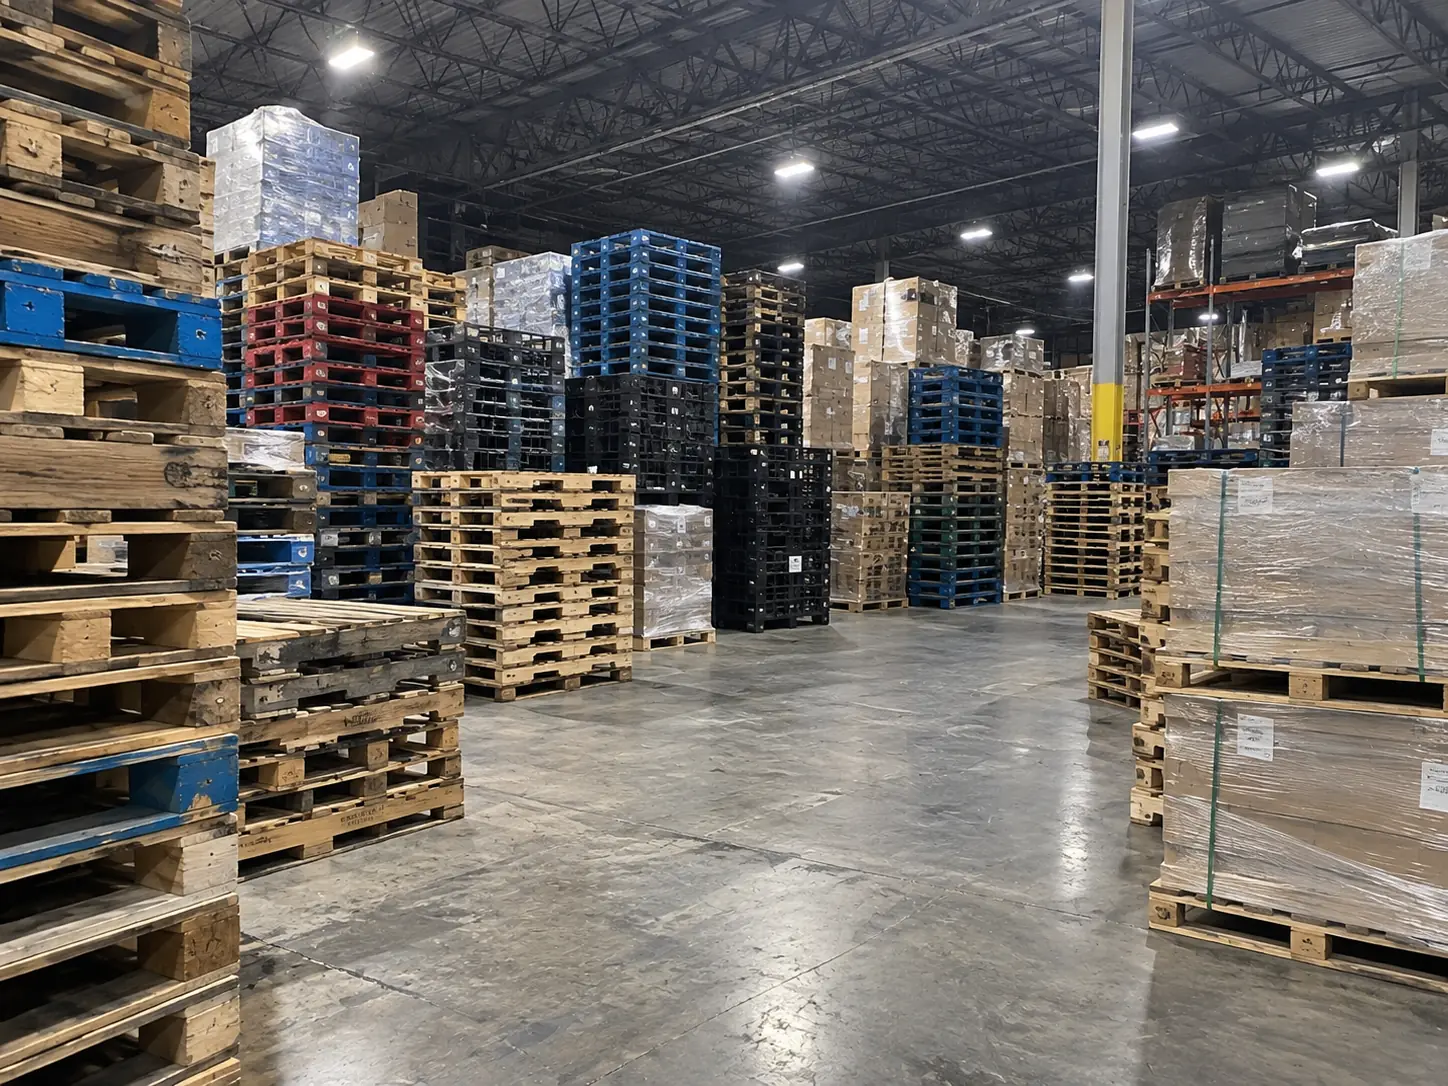
A recycled pallet cannot be manufactured on demand. It has to arrive as a core, and cores arrive when somebody finishes with them. That single fact makes this market behave unlike almost any other packaging category: supply is a by-product of somebody else's activity, and it is at its thinnest exactly when demand is at its highest.
Through late summer, distribution centres and manufacturers build inventory ahead of the retail peak. Pallets that would normally be emptied and released are instead sitting under product in a rack. The pile behind the building — our raw material — shrinks precisely as the order book grows.
The calendar, roughly
| Period | Core supply | Demand | Practical effect |
|---|---|---|---|
| January – March | Very strong — holiday stock unwinds | Soft | Cheapest buying window of the year |
| April – June | Good | Steady | Stable pricing; good time to set an annual agreement |
| July – August | Tightening | Rising | The turn happens here, quietly |
| September – November | Thin | Peak | Widest A-to-economy spread; lead times stretch |
| December | Improving | Falling | Cores begin returning; pricing eases |
What a buyer can actually do about it
- Set annual volumes in the spring, when the market is calm and neither side is negotiating under pressure.
- Right-size grade before you negotiate price. Moving internal-movement pallets from A to #2 saves more than any Q4 haggling will.
- Buy forward into Q4 if you have floor space. Pallets do not spoil, and 600 units occupy one trailer footprint outdoors under cover.
- Release your own cores in Q4 rather than holding them. That is the month they are worth the most, and it is the month most operations forget they have them.
- Avoid spot buying in October and November. It is the most expensive way to buy this product and the lead times are at their longest.
Appendix: the data behind this
Every piece on this site closes with the slice of our operating record that bears on what it argues. The full record is published at /resources/operating-record.
Core supply against demand, indexed
The gap between the two lines is the whole argument. Supply peaks in January when demand is weakest, and collapses in October when demand is strongest.
Read this chart as a table
| Month | Core supply | Demand |
|---|---|---|
| Sep | 92 | 114 |
| Oct | 86 | 121 |
| Nov | 81 | 118 |
| Dec | 89 | 96 |
| Jan | 127 | 78 |
| Feb | 121 | 82 |
| Mar | 112 | 91 |
| Apr | 106 | 97 |
| May | 103 | 101 |
| Jun | 98 | 106 |
| Jul | 94 | 109 |
| Aug | 91 | 112 |